By default LaTeX tables allow three basic types of column alignment: Left-aligned, centered, and right-aligned. Sometimes neither of these choices looks very good, particularly if the column header is wider than the contents of the column body. Several packages exist to deal with this issue. However, they are restricted to figures and don’t work with text in the table body. Using the eqparbox package it’s possible to define a new column type which i.e. right-aligns the column’s contents and then collectively centers the whole block in regard to the column header. After describing the general idea this article also shows how to avoid minor horizontal or vertical misalignments like those introduced by the microtype package.
The problem
When you create LaTeX tables using the tabular environment you have to specify the alignment per column. You can choose between the four specifiers l, c, r, and p. The first three make sure the column is left-aligned, centered, or right-aligned, respectively. The specifier ‘p’ also left-aligns the contents, however in contrast to the ‘l’ specifier it requires an additional parameter that sets the column’s width. If the text is wider than the defined column width LaTeX performs automatic line-break and justifies the text to the specified width.
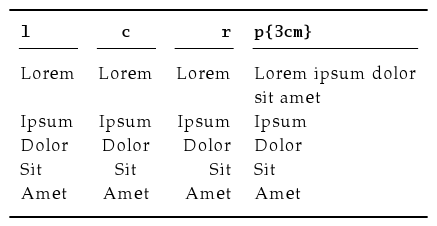
Often times the default column types are sufficient to produce good-looking tables. One thing crucial is the width of each column header compared to that of the column body. In the example above the column headers are narrow compared to the text in the body. Take a look at the example below where it’s the other way around.
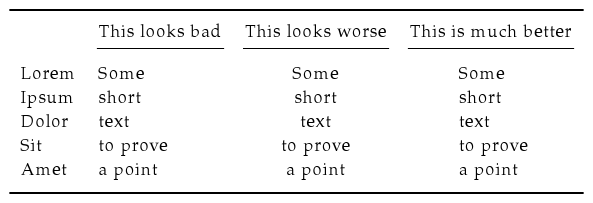
As you can see it looks better to have text left-aligned than to have it centered. Even the left-aligned column looks less than favorable though, as the column header is wider than the body which produces a lot of white space to the right of the table body text. One solution might be to break the column header into multiple lines. The other solution is shown in the right column: The text from the various rows is left-aligned relative to each other and that whole block is centered in regards to the column header. The technique to achieve this type of alignment is described below.
Figure-only columns
Some packages exist to create better-looking column alignment than LaTeX offers by default. However, they are restricted to work with figures. This may stem from them being used predominantly inside tables, but it’s also just a lot easier to properly align them. This is because in most fonts the width of each digit is the same whereas for letters and other characters that’s generally not the case. Therefore, if you know the number of digits you want to typeset you can get the figure’s total width through a simple multiplication – regardless of what actual digits the figure is made up from.
The table below shows the output generated using the standard ‘l’ column specifier as well as that from the three packages siunitx, dcolumn, and rccol.

The siunitx package does a lot more than align table contents properly. It is useful when dealing with physical units which is why you may already use it in your document. When dealing with tables you can use the column specifier ‘S’ provided by the package. It can be customized to result in an alignment like the one shown above. It was generated with the column specifier S[tabnumalign=centre,tabformat=2.3]. The ‘2.3’ informs LaTeX that the column width is that of two integer digits plus the decimal point plus three radix digits. You have to make sure this setting matches the column’s data, otherwise the alignment will not be proper anymore. In order to exempt the column header—which is usually some text—from the figure alignment, place it inside braces. For more details on the customization options refer to the siunitx package documentation.
In cases where your table contains plain figures without any units you can get the same output by using the dcolumn package. It also requires you to define the figure format inside the column specification. Additionally, you have to specify the character used as a decimal point in your TeX sources and the one which should be used in the output. This would for instance allow you to process figures with a decimal point in your sources to be displayed with a decimal comma in the output, which is required i.e. in a German text. This is achieved through the column specifier D{.}{,}{2.3}. As the column header or any other text part can’t be properly formatted when using the ‘D’ column specifier, you have to change the column type for them. To do that, use \multicolumn{1}{c}{Column header text}.
Finally, the third solution to properly align figures inside tables comes with the package rccol. In its most basic form it produces an output just like that obtained using the dcolumn package. The only difference is the column specifier letter ‘R’ and the slightly different syntax to define source and output decimal sign as well as the number of digits before and after the decimal point. One thing special about rccol is its ability to round figures to the specified number of digits. Rounding is enabled by loading the package via \usepackage[rounding]{rccol} and disabled with the parameter norounding. When using text, i.e. in the column header, you also have to escape it as \multicolumn{1}{c}{Column header text} since LaTeX otherwise complains about a missing number.
The numprint package may be another option, particularly when dealing with figures using scientific notation, i.e. 1.23 · 1045. Please refer to the package documentation on how to use it.
When typesetting figures one has to differentiate between old-style figures and lining figures. The latter have a constant height which equals that of uppercase letters that don’t extend below the baseline, like ‘A’ but unlike ‘J’ and ‘Q’. In contrast, old-style figures have varying heights that may be equal to that of a lower-case ‘x’, i.e. ‘1’, or have ascenders like ‘d’, i.e. ‘6’, or descenders like ‘p’, i.e. ‘9’. This property makes old-style figures mesh well with running text or small-caps whereas lining figures look better in conjunction with upper-case letters.

In math mode it’s strongly recommended to use lining figures, as the varying height of old-style figures might lead to regular numbers being interpreted as subscripts or superscripts. Apparently this is why the configuration parameter [osf] of the mathpazo package enables old-style figures solely in text mode but keeps using lining figures in math mode. This becomes important when using either siunitx or dcolumn to align table figures. Both packages use math mode to typeset figures which means figures in the respective table columns will be typeset using lining figures. Whether that is a good or a bad thing depends on your personal preferences. When using the siunitx package you can switch to old-style figures on a per-column basis by adding the argument [valuemode=text] to the column specifier ‘S’.
The initial solution
The previous section described how to properly align figures inside tables. Neither of the packages described offers any solution to aligning text, though. The major problem is that in contrast to figures the width of text is variable (aside from fixed-width fonts). Because of that it’s impossible to specify the text’s width without parsing it first. Unfortunately, for proper alignment you would have to know the width in advance.
A solution comes in the form of the eqparbox package. It provides the \eqparbox{ID}{content} command. In a first step the maximum width of all eqparboxes with the same ID is calculated. This requires parsing of the whole document so that the result can be used in a subsequent LaTeX run. Once the maximum width is known, the content of each eqparbox is placed in a regular parbox of said maximum width. Putting these boxes in a centered table column results in an output like the one shown below.
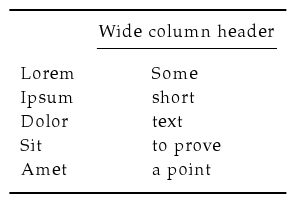
The following source code was used to generate the table above:
\usepackage{booktabs}  % publication-quality tables
\usepackage{eqparbox}  % sub-align table cells

\begin{tabular}{l c}
  \toprule
  \addlinespace
        & A wide column header                \\
  \cmidrule(lr){2-2}
  \addlinespace
  Lorem & \eqparbox{demo-id}{\strut Some}     \\
  Ipsum & \eqparbox{demo-id}{\strut short}    \\
  Dolor & \eqparbox{demo-id}{\strut text}     \\
  Sit   & \eqparbox{demo-id}{\strut to prove} \\
  Amet  & \eqparbox{demo-id}{\strut a point}  \\
  \addlinespace
  \bottomrule
\end{tabular}
It works but is quite inflexible when it comes to modifying the column layout later on. Having the text right-aligned inside the block could be achieved relatively easy by creating a macro \eqparboxr (notice the additional ‘r’) via \newcommand{\eqparboxr}[2]{\eqparbox{#1}{\raggedleft #2}} and then replacing the \eqparbox command with it. The major weakness remains though, in that the same modification has to be performed for each line of the table.
Before we move on to the comfortable solution let’s examine the importance of the \strut commands used in the example above. They advise TeX to increase the height of the box the words are put in so that it would fit both ascenders and descenders. Without an explicit \strut the box is made to accurately fit the height of the particular text. Possibly due to a bug in the \eqparbox implementation this results in a mismatch of the baseline. The enlarged example below demonstrates the effect.
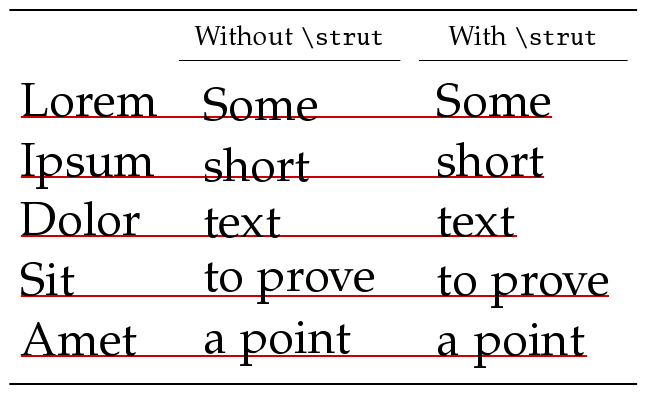
As you can see, text with descenders inside an \eqparbox without \strut is positioned too high whereas text with ascenders is positioned too low. Adding a \strut remedies the problem.
The comfortable solution
It is desirable to specify an entire column as ‘block-centered’ instead of doing so for every table entry. Much like the alignment of figure-only columns described earlier, one would want a column specifier that contains all of the alignment details whereas the table body consists solely of the raw data. Fortunately this is possible utilizing the \newcolumntype command provided by the array package which is automatically loaded by the eqparbox package. By writing \newcolumntype{i}[1]{ >{\itshape} c <{#1} } you could for example create a new column specifier ‘i{argument}’ that would produce italic, centered output followed by what’s defined as the column specifier’s argument. Now you could produce a table like the one below.
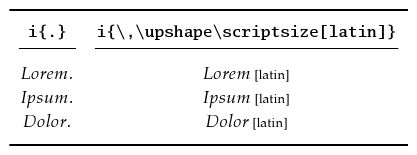
In trying to apply the same idea to an \eqparbox column specifier we encounter a problem. The argument is put in braces and LaTeX has no means to distinguish them from the braces of the \newcolumntype command. Thus writing \newcolumntype{x}[1]{ >{\eqparbox{#1}{} c <{}} } results in an error as the red braces inside >{} and <{} are unbalanced.
Solving this problem requires a more elaborate approach. First, a temporary storage box is defined using \newsavebox{\tempbox}. The storage is filled with what’s inside a \begin{lrbox}{\tempbox} ... \end{lrbox} block. The box can then be typeset using \unhcopy\tempbox. Putting it all together yields the following LaTeX code:
\newsavebox{\tempbox}
\newcolumntype{X}[1]{%
  >{ \begin{lrbox}{\tempbox} }%
  c%
  <{ \end{lrbox}%
     \eqparbox{#1}{\strut\unhcopy\tempbox}%
   }%
}
Using this new column specifier you can now write the previous example more comfortably as
\begin{tabular}{l X{demo-id2}}
  \toprule
  \addlinespace
        & \multicolumn{1}{c}{A wide column header} \\
  \cmidrule(lr){2-2}
  \addlinespace
  Lorem & Some     \\
  Ipsum & short    \\
  Dolor & text     \\
  Sit   & to prove \\
  Amet  & a point  \\
  \addlinespace
  \bottomrule
\end{tabular}
This gives the same result as before, but with less typing and more flexibility regarding modifications at a later time.
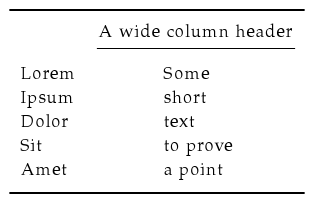
Notice, however, that with the new column specifier the column header has to be encapsulated inside a \multicolumn command. In contrast to the alignment of figures using special column specifiers that don’t work with text, this time omitting the \multicolumn produces only a semantic error. As the wide header would be included in the width calculations the end result would be a left-aligned column much like that generated using the ‘l’ column specifier.
Before we can get to the final solution there’s one more issue to be addressed. The microtype package by default enables margin kerning which slightly shifts some characters into the page margin in order to produce a margin that looks straight to the human eye. Inside tables with a default LaTeX column specifier like ‘r’ this feature is disabled, but when using the newly defined ‘X’ specifier it is activated again.
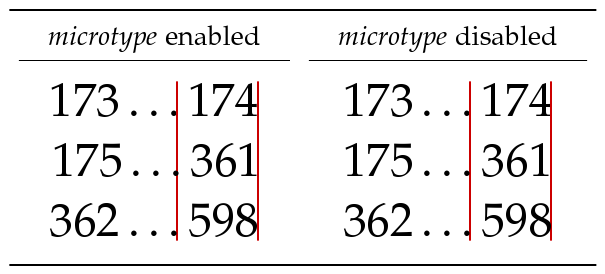
As you can see in the enlarged example above, the middle row gets slightly shifted to the right if microtype is loaded and margin kerning is activated. This properly aligns the one in 361 to the four in 174, but it also misaligns the dots. Additionally, the 175 is misaligned relative to the 173. The solution with microtype disabled is better-looking as the alignment of the numbers to the left and of the dots is more important than a smooth right border.
The simple solution is to globally disable microtype or at least its margin kerning feature. Of course this can only be a last resort, and luckily another option is available. The command \microtypesetup{activate=false} can be used to selectively disable microtype. This command, however, is only defined if the microtype package has been loaded. A generally applicable solution is required not to break depending on the packages loaded. Therefore it requires a switch based on \@ifpackageloaded. Depending on how that command evaluates the column specifier is defined to either deactivate microtype inside the table or not bother because the package isn’t loaded.
\newsavebox{\tempbox}
\makeatletter
\@ifpackageloaded{microtype}
{ % microtype package loaded
  \newcolumntype{A}[1]{%
    >{ \begin{lrbox}{\tempbox} }%
    c%
    <{ \end{lrbox}%
       \eqparbox{#1}{\microtypesetup{activate=false}%
                     \strut\raggedright\unhcopy\tempbox}%
     }%
  }
  \newcolumntype{B}[1]{%
    >{ \begin{lrbox}{\tempbox} }%
    c%
    <{ \end{lrbox}%
       \eqparbox{#1}{\microtypesetup{activate=false}%
                     \strut\raggedleft\unhcopy\tempbox}%
     }%
  }
}{ % microtype package not loaded
  \newcolumntype{A}[1]{%
    >{ \begin{lrbox}{\tempbox} }%
    c%
    <{ \end{lrbox}%
       \eqparbox{#1}{\strut\raggedright\unhcopy\tempbox}%
     }%
  }
  \newcolumntype{B}[1]{%
    >{ \begin{lrbox}{\tempbox} }%
    c%
    <{ \end{lrbox}%
       \eqparbox{#1}{\strut\raggedleft\unhcopy\tempbox}%
     }%
  }
}
\makeatother
Conclusion
The solution presented above allows to create ‘block-aligned’ table rows with the contents of the block being either left-aligned or right aligned towards each other using column specifier ‘A’ or ‘B’, respectively. The actual letters can be modified if they conflict with those introduced by other packages. Unless you know what you’re doing every column should have a unique identifier defined as part of the column specifier. Column headers or other elements that should be exempt from the alignment are to be encapsulated in a \multicolumn{1}{c}{contents} construct. Two LaTeX runs are required to get the maximum width per column identifier and thereby the proper alignment. Both horizontal and vertical alignment of the table data is assured. Now you know how to make tables with columns like the right one in the example below.

Honestly this output could have been achieved using the dcolumn package and a D{!}{\,\ldots\,}{3.3} column specifier in conjunction with source code data in the form 1!172 as well. However, dcolumn uses math mode to display both digits and separator, so this might restrict its use. If, for example, instead of the dots any kind of text should be used to replace the exclamation mark, it would be in italics.