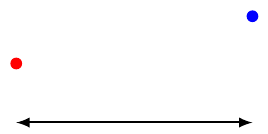
Let’s assume you have two coordinates or nodes in your TikZ picture. You now want to add an annotation to identify the distance between these two points. However, you only want to show the distance along the x-axis whereas you don’t care for the distance along the y-axis. This means that you expect a straight horizontal line. Unfortunately the two points do have different y coordinates. You decide to vertically offset the annotation from the two points, yielding a diagram like this:
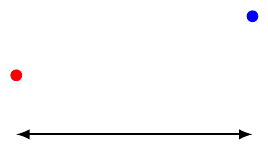
When talking about the diagram, let’s call the red node (A) and the blue node (B).
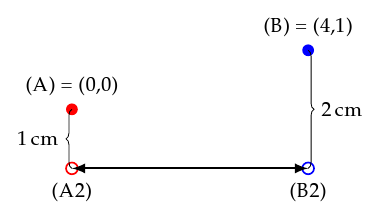
All is well so long as the vertical (y-axis) distance between (A) and (B) is an integer like 1 cm or at least an even fraction like 0.25 cm. In that case you can generate the diagram above by explicitly calculating the start and end points of the annotation arrow. Let’s name these (A2) and (B2) just like in the diagram below.
You have decided to put the arrow 1 cm below the lowest of the two nodes which is (A). Using the calc TikZ library, you can calculate (A2) by writing \coordinate (A2) at ($ (A) - (0,1) $);. As you know the integer vertical distance between (A) and (B), to calculate the position of (B2) you write \coordinate (B2) at ($ (A) - (0,2) $);. The following figure shows just that. It is the same as the previous one, except for the added node/coordinate names and position/distance information.
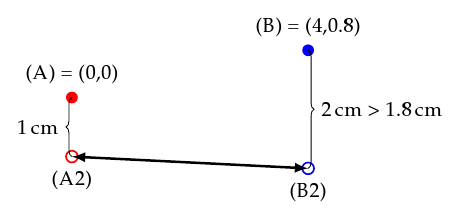
However, move the vertical coordinates by fractions of a centimeter and the line in the bottom is not horizontal anymore. In the example below (B) was moved down by 0.2 cm whereas (B2) continues to be calculated as being 2 cm below (B). Obviously this results in (B2) being too low and the annotation line having a downward slope.
So long as you know (B) to be vertically shifted from the position you initially assumed (that would be at y coordinate 1.0 cm instead of 0.8 cm) you can adjust the calculation of (B2) accordingly. Insofar this example is academic. But what if you never explicitly specified the coordinates of (A) and/or (B) but instead have them calculated automatically through the various means TikZ offers? And what if that results in a shift much more arbitrary, like 0.18362 cm instead of 0.2 cm? Figuring out that shift by hand and adjusting for it in the calculation of (B2) is not only tedious, it also requires the same amount of fiddling once you slightly change the relative coordinates of (A) and (B).
The solution comes in the form of projections. Projections are based on three coordinates (or nodes). TikZ calculates an imaginary line between two of the three points, with the line actually going beyond these two end points. Then another imaginary line is calculated that starts in the third specified point and intersects the other imaginary line perpendicularly. The result you as a user get is the coordinate of that intersection. The diagram below makes use of this feature to get a horizontal annotation line starting from (A2) without ever explicitly specifying the vertical distance to (B). Note that (B) is still shifted relative to its original position in the beginning of this document.
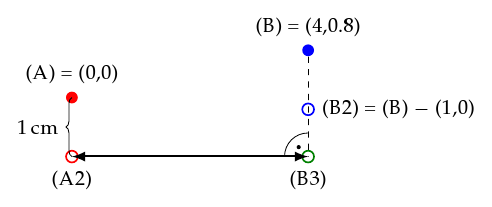
In the figure above, a new coordinate (B3) is introduced. This coordinate is calculated using projections with the TikZ code \coordinate (B3) at ($ (B)!(A2)!(B2) $);. Beforehand (B2) has been defined as \coordinate (B2) at ($(B) - (0,1)$);, however the actual position of (B2) is irrelevant so long as it lies straight above or below (B) and is not shifted horizontally. When calculating (B3) using projections this means that the first imaginary line mentioned previously starts in (B) and vertically stretches towards plus/minus infinity. In other words, (B2) lies on that imaginary line just as (B3) does. The dashed line represents a part of that imaginary line.
The second imaginary line coincides with the horizontal annotation line stretching from (A2) to (B3). This is, however more of a coincidence. The annotation line still has to be drawn in an additional step once (B3) has been calculated.
As has been shown in this document, it’s possible to draw horizontal annotations to clarify the distance between two coordinates or nodes. This is possible specifying only the two coordinates themselves plus an optional vertical shift (here: 1 cm). TikZ then takes care of making the annotation line perfectly horizontal.
Here’s the code of the example:
\usepackage{tikz}
\usetikzlibrary{calc}
\tikzset{>=latex}
\tikzstyle{a}=[fill=red,circle,inner sep=2pt]
\tikzstyle{b}=[fill=blue,circle,inner sep=2pt]

\begin{tikzpicture}
  \node [a] (A) at (0,0) {};
  \node [b] (B) at (4,0.8) {};

  \coordinate (A2) at ($ (A) - (0,1) $);
  \coordinate (B2) at ($ (B) - (0,1) $);
  \coordinate (B3) at ($ (B)!(A2)!(B2) $);

  \draw [<->,very thick] (A2) -- (B3);
\end{tikzpicture}
